

Visualize Measurements with Location Data on the Channel View
https://ww2.mathworks.cn/help/thingspeak/create-custom-channel-view.html
For this channel, the prototype sends position data along with the sensor measurements. One application is to survey a large area with temperature and moisture measurements and visualize the data with location.
As in the previous example, add a new MATLAB visualization using the button on your channel view. Read the most recent points with thingSpeakRead, and plot the location data with goescatter. Use geobasemap to select satelite map data.
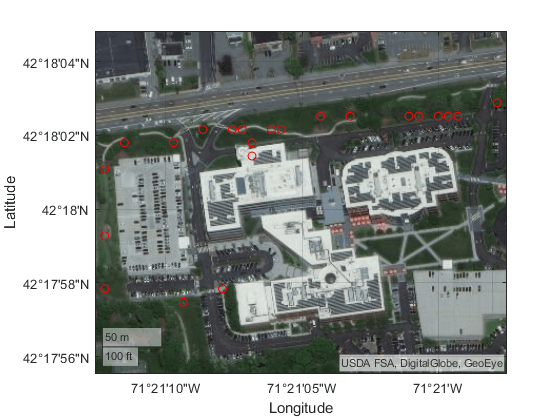
The map provides a good visualization of the positions. Include temperature and moisture data in the map to improve the visualization. When the measurement device is moved from one location to another it can make an inaccurate moisture measurement before the probe is replaced in the ground. Remove any data with values less than 500 in the soil moisture data in column two. Then rescale the data for visibility. Add the moisture data to the goescatter function to determine the size of the circles, and the temperature data to determine the color. Use the ‘filled’ option to fill the circles.
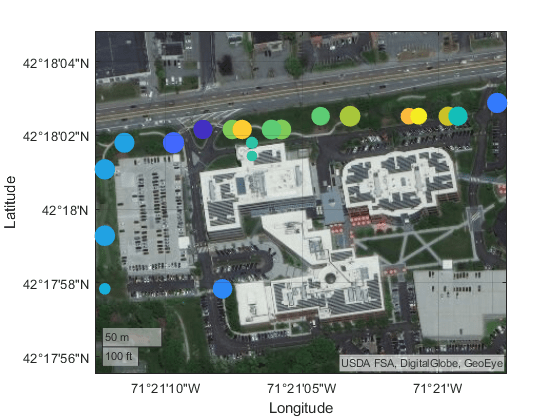
The subtle effect of warmer locations in front of the building leads to some smaller circles indicating drier soil, except on the right where the sprinklers had just finished.
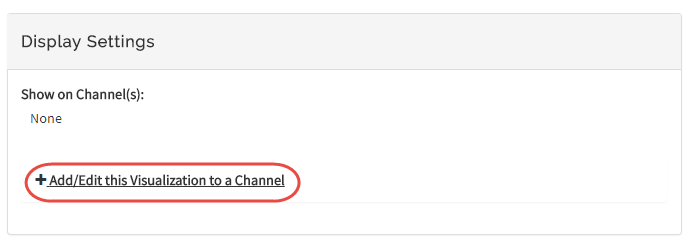
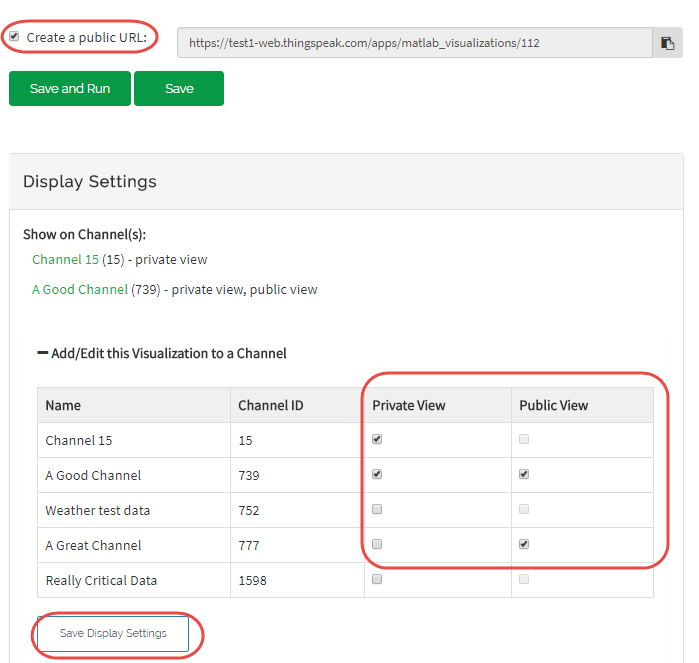
You can add saved visualizations to the public and private views of your channel. In Display Settings, use the plus sign next to Add/Edit this Visualization to a Channel to expand the channels list.
Select the check box that corresponds to the channel you want to add the visualization to. To add private visualizations, select Private View. To share the URL and add the visualization to the Public View, click Create a public URL. To update your selections, click Save Display Settings.


No comments:
Post a Comment